Well, I was looking up the last article I wrote for you and found I haven’t written anything in over a month! My surprise! To be honest, the past month has been full of work and play, with a couple of Red Rocks concerts here and there. We got to see Old Dominion and Billy Strings. Both were excellent shows. The new roof on the pavilion has done much to increase the quality of sound there.
But you’re reading this because of the market, not music.
The market here continues to be strong. It’s surprising the strength of prices and the little amount of inventory. National news and smart people say there has been price declines across America. That hasn’t been seen much in Steamboat Springs. The price reductions that have been seen most commonly are those properties that were over-priced, to begin with.
Here’s a graph that I took a screenshot of on June 13:
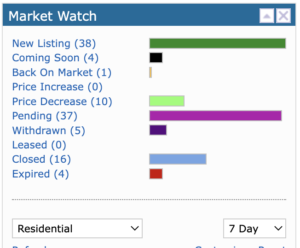
This graph is more normal than I have seen in a few years. The number of Pending listings to those that are New looks like the activity of the past few years, however, listings that are Back On Market and Price Decrease are steady. In the past few years, these categories were commonly zero. Today, they are more consistently showing up.
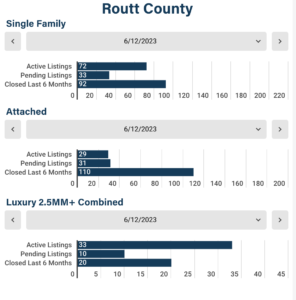
Here’s a graph on current inventory in the Steamboat area, as well as the number of listings sold in each category for the last six months:
And compare this graph to six months ago:
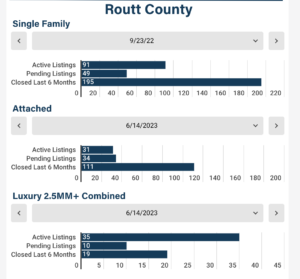
These graphs indicate a smaller number of transactions occurring over the last six months. The inventory is limited with 29 condos/townhomes available. Often, in past years, this number can be 3 times this amount. The number of single-family homes is larger simply because there are so few homes priced under $500,000 for a working family to purchase. That being said, there is a lot less to choose from six months ago.
To me, these graphs indicate that there is a strong market for buying and selling. If selling, and the home is priced right, it will sell quickly. Also, this indicates a large number of buyers. The brokers I talk to often indicate they have more buyers than inventory on the market. My experience is the same.
The only sector of the market that I have seen values lower is mobile homes. This is due to lot rents climbing, interest rates rising, and the need for borrowers to have 30% down to purchase a home, which is commonly $40,000 or more.
Finally, over the past months, I’ve talked about changes in prices across the nation. Here is a graph from the Federal Reserve Board on housing prices:
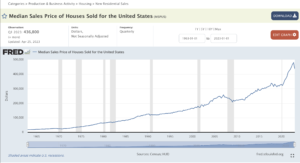
This indicates the median sales price. To me comparing the changes in value over time, there is an organic line prior to the pandemic. After this, which is when money was cheap to borrow, the graph changes to a direct upslope. With interest rates rising at the start of the apex, buying power decreased. I’m very interested in when this downtrend will ease and a natural ebb and flow of median prices take place.